6 Ways of Measuring Mobility Efficiency in Confined Area
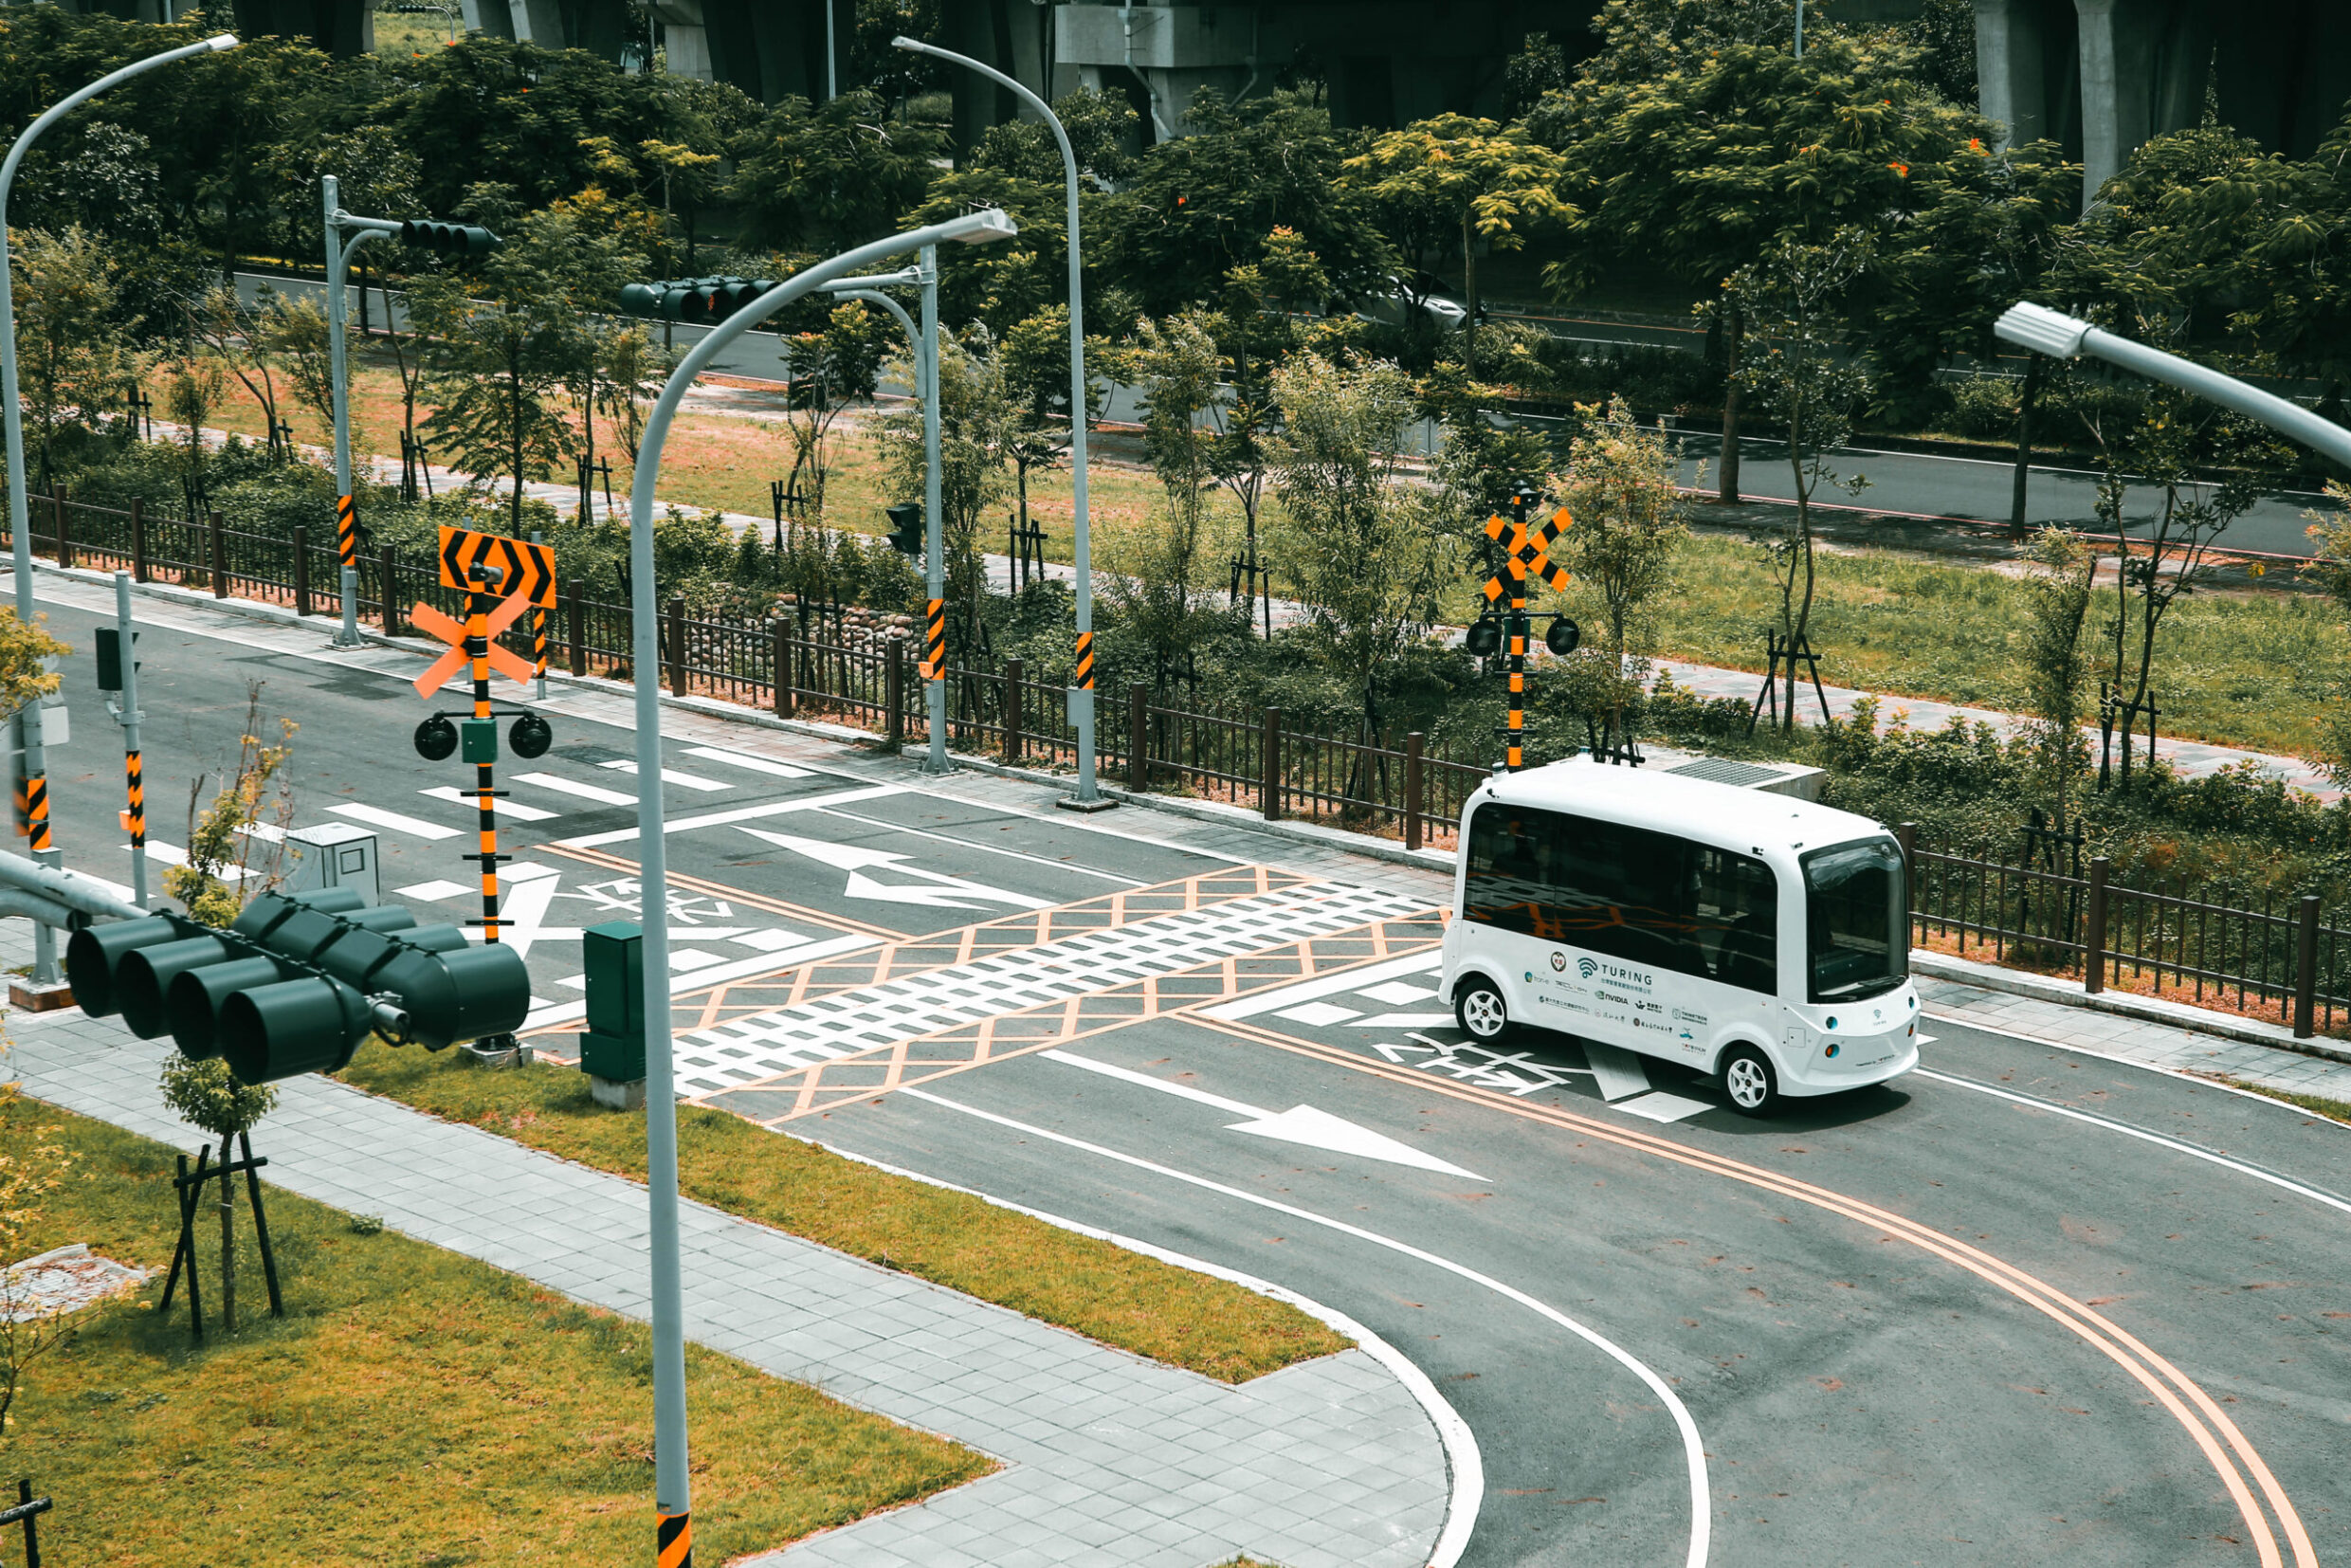
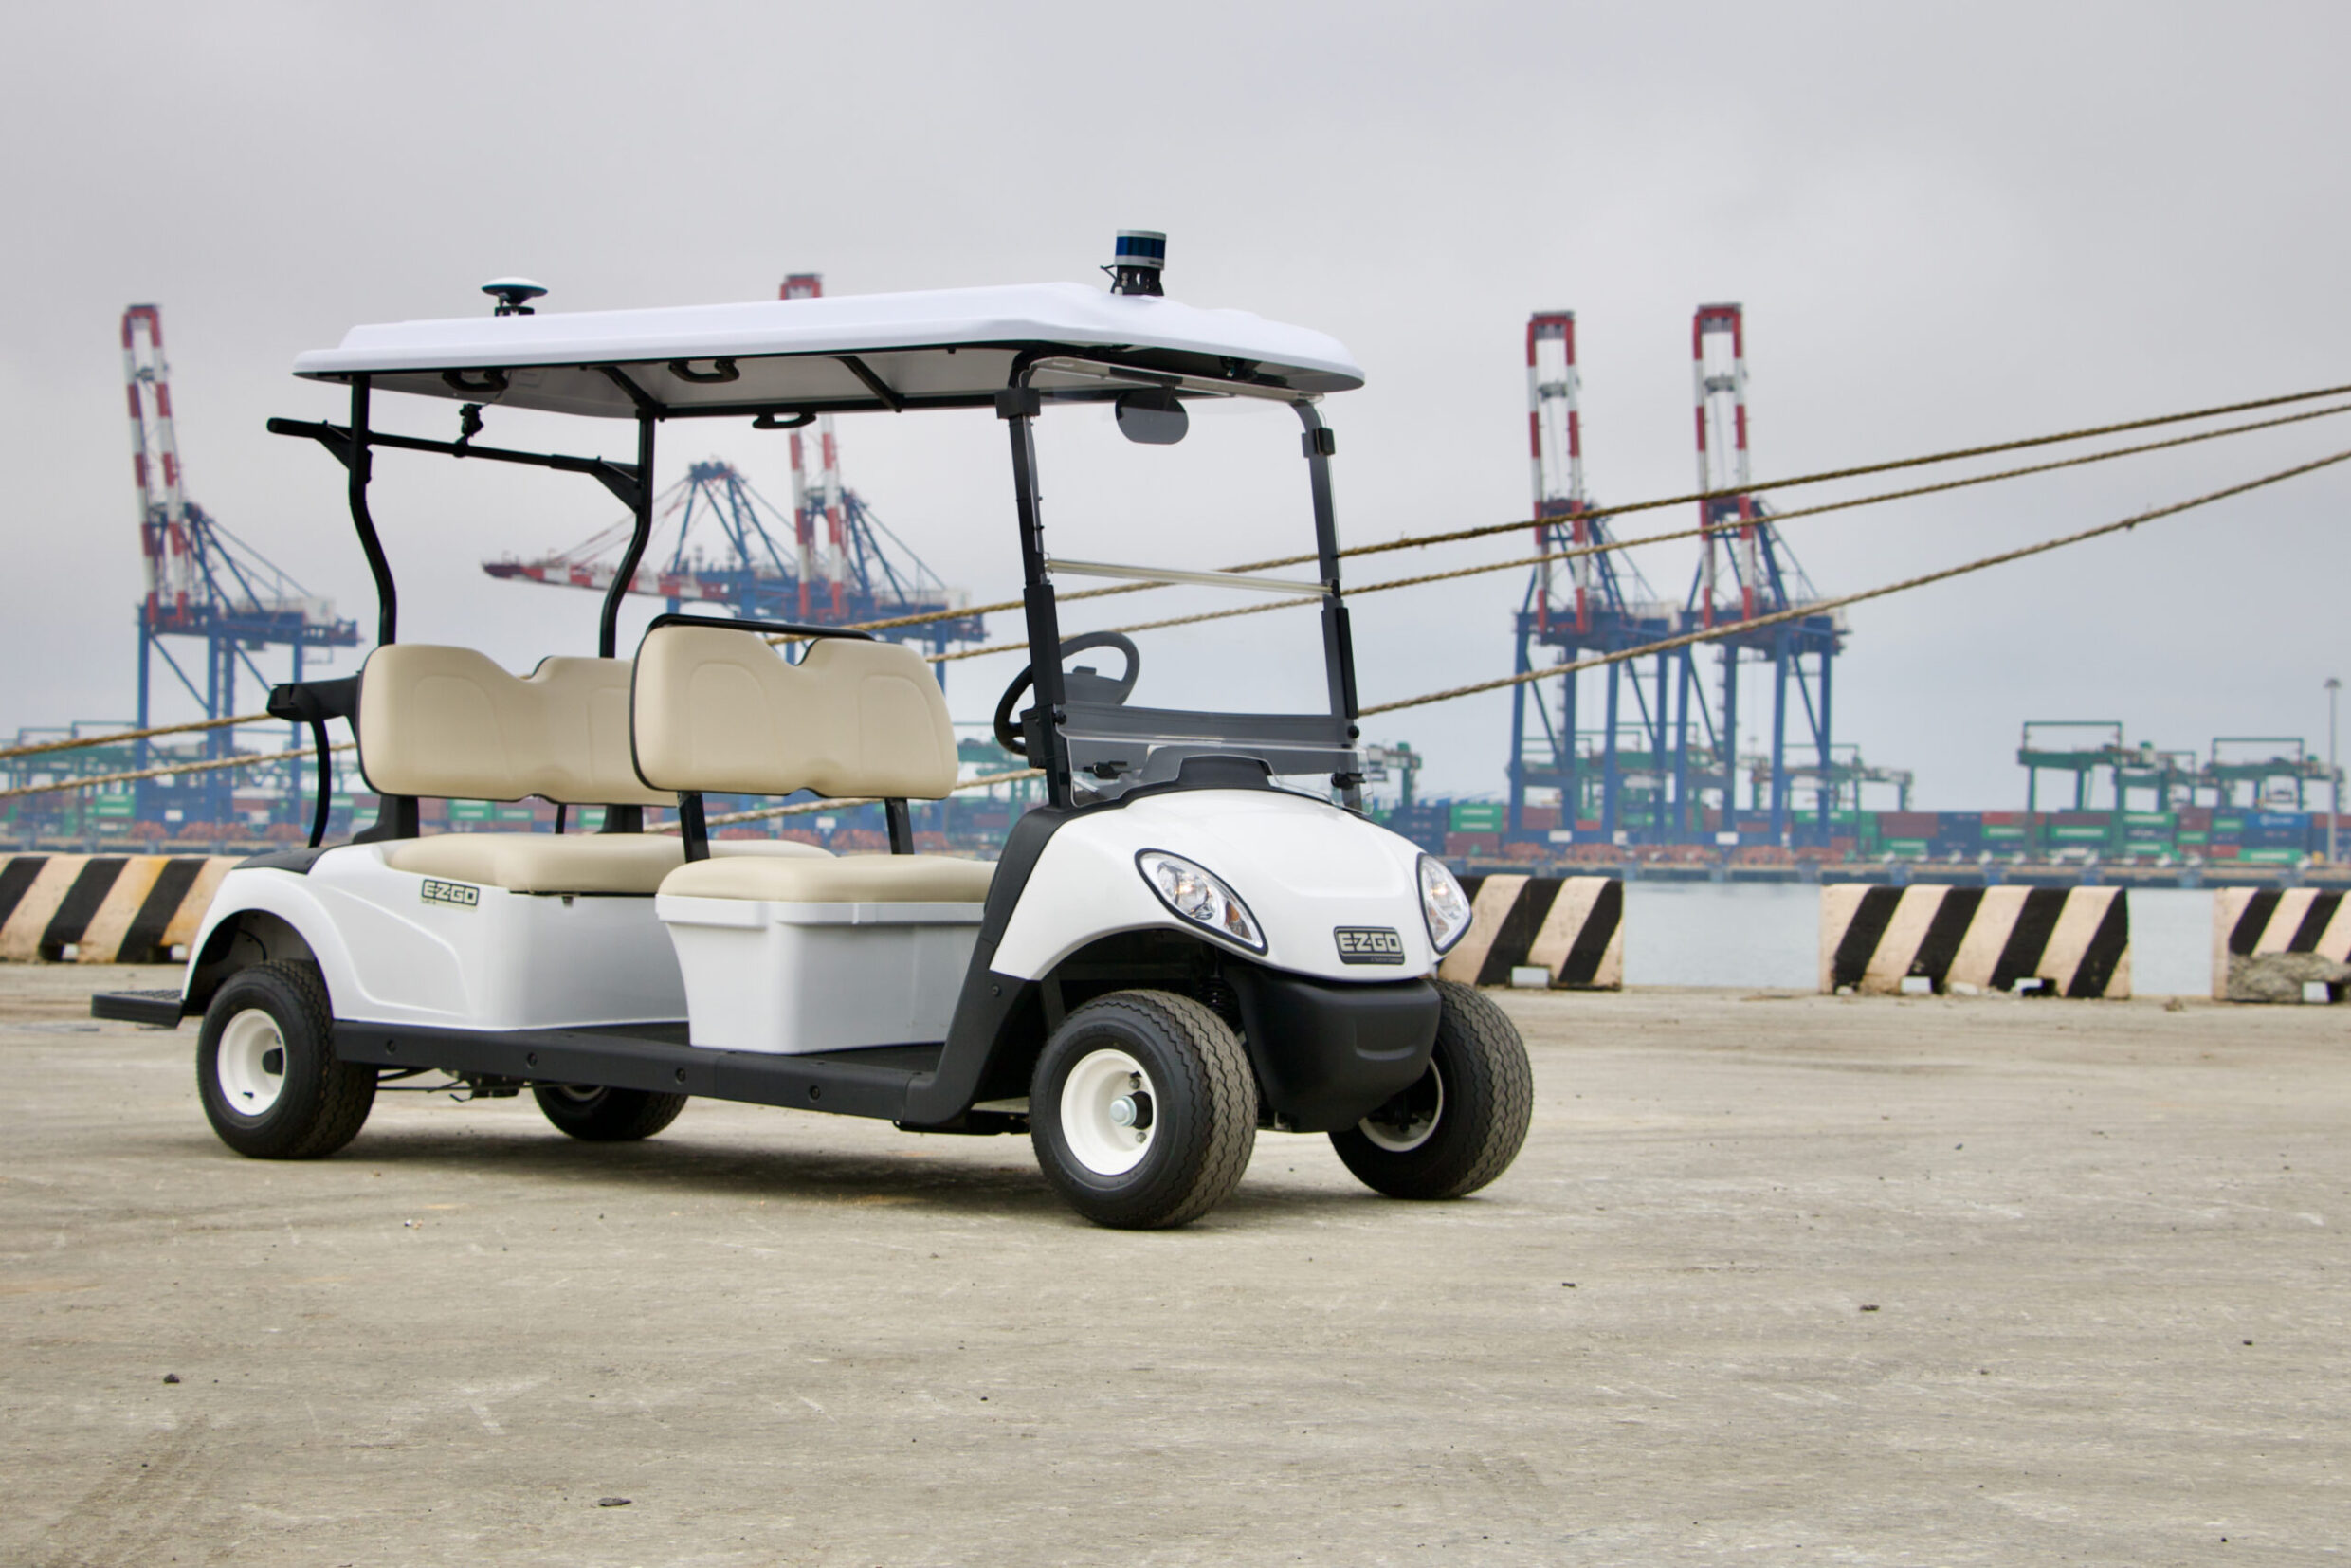
What’s the benefit of low-speed autonomous driving (LSAD) for confined-area business operators? Can we effectively assess and evaluate the impact before and after introducing LSAD to a filed site? How to set a fair objective for an LSAD project? The answers may lie in the study of Transport Economics.
“Transportation systems are subject to constraints and face questions of resource allocation. The topics of supply and demand, as well as of equilibrium and disequilibrium, arise and give shape to the use and capability of the transportation system. Transport Economics is the study of the movement of people and goods over space and time. It is a branch of economics that deals with the allocation of resources within the transport sector.” (WIKIBOOKS)
As Transport Economics has contributed to public transport and road traffic, few have applied it to examine mobility in confined area—from a micro perspective. The movement of people and goods are no less complex in industrial part, gated community, or even amusement park. Although each site presents unique use cases, the demand for efficiency is unequivocal, especially when mobility efficiency directly impact business performance.
Many of the confined-area mobility issues are economic trade-offs. Examples are many. For a factory owner, dedicated drivers add up to headcount. In a gated community, waiting time accrues opportunity cost. In an amusement park, the number of passengers taken equals to customer satisfaction or ticket sales.
Measurement Tools
To improve the wellbeing of confined area stakeholders, we turn to Transport Economics. Thanks to a group of transport planners, including the CEO, Turing Drive has proposed six indices that help define and examine mobility efficiency in confined area:
- Productivity per capita is the average economic output of staff, which increases after the introduction of LSAD that allows people to spend more time on non-driving tasks.
- Availability is the number of pick-up/drop-off points within a geofence, which tends to increase with LSAD that enables on-demand mobility at low costs.
- Frequency is the average number of pick-up/drop-off per point per hour, which is likely to increase as flexible and dynamic routing algorithms make sure the maximum service capacity.
- Waiting time is the average waiting time for passengers/goods, which would reduce as a result of high availability and frequency.
- Travel time is the average onboard time for passenger/goods, which may reduce if enough LSAD vehicles are deployed.
- Operation hours is the total number of hours during which mobility services are available (under consistent service level agreement). As there won’t be regular “shifts” of human drivers, this index should increase after LSAD takes over.
Simulation of LSAD Benefits in a Resort
A medium-sized resort is struggling to improve their bottom line. Understaffed with uneven visitor number between peak and off-peak times, the site barely manages to operate a fixed-route, fixed-schedule shuttle, given the following conditions:
- 30 hectares of land
- 180 rooms
- 25 villas
- 25 mins for a full round trip
- 15 low-speed shuttles (6-seater)
- 20 designated drivers and 15 non-designated drivers to run the fleet.
The table below shows a comparison of mobility efficiency before and after the replacement of the current manned shuttle fleet by 20 LSAD vehicles. One should expect significant improvement across all the six indices defined by Turing Drive, as LSAD allows the resort to offer flexible, consistent, and extended shared mobility with a smart routing/scheduling/dispatch system.
Enhanced productivity, efficiency and convenience by LSAD
| Index | Before | After |
| Productivity per capita | a dedicated person only drives the shuttle | he/she now helps with other non-driving tasks |
| Availability | only 5 stops along a fixed route | 15 stops distributed across the resort |
| Frequency | 1 pick-up/drop-off at each stop per hour | 3 pick-up/drop-off at every stop per hour |
| Waiting time | 15 mins | 5 mins |
| Travel time | 20 mins for every trip | 7 mins for every trip |
| Operation hours | 8 hours per day | 16 hours per day |
Autonomous Driving Gives MaaS the Final Push
Transport economics looks into the demand and supply of mobility. In theory, people acquire “positive utilities” when they consume goods, services, or the basic needs. However, they bear the cost of vehicle, fuel, travel time, waiting time, walking time, etc. of mobility services–all about “negative utilities”. In other words, they pay to suffer from mobility.
The invention of mobility as a service (MaaS) seems to be a cure. With MaaS, people enjoy customized services without having to purchase cars or without having to drive. Nevertheless, the cost of drivers is still there, and eventually customers have to pay for driver’s wages and ensuing management cost behind transport operation.
Automated and shared mobility service, though, is a perfect deal. Autonomous MaaS brings together the seemingly incompatible benefits at once–accessibility, efficiency, safety, and cost-effectiveness. It is the holy grail of every transport planner. That is also what Turing Drive strives for.


